Cascadia Research has been collaborating with the Northwest Fisheries Science Center of NOAA Fisheries, Fisheries and Oceans Canada, the Alaska SeaLife Center, the National Marine Mammal Laboratory, and the Center for Whale Research, to examine movements and habitat use of mammal-eating killer whales using remotely-deployed satellite tags.
Download a poster presentation on this work (#### not found on Cascadia site) from the Fourth International Science Symposium on Bio-logging, Hobart, Tasmania, March 2011.
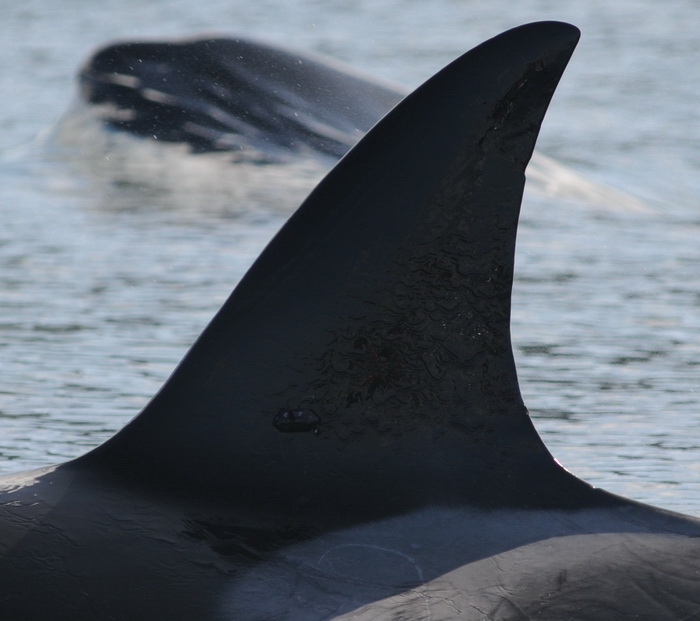
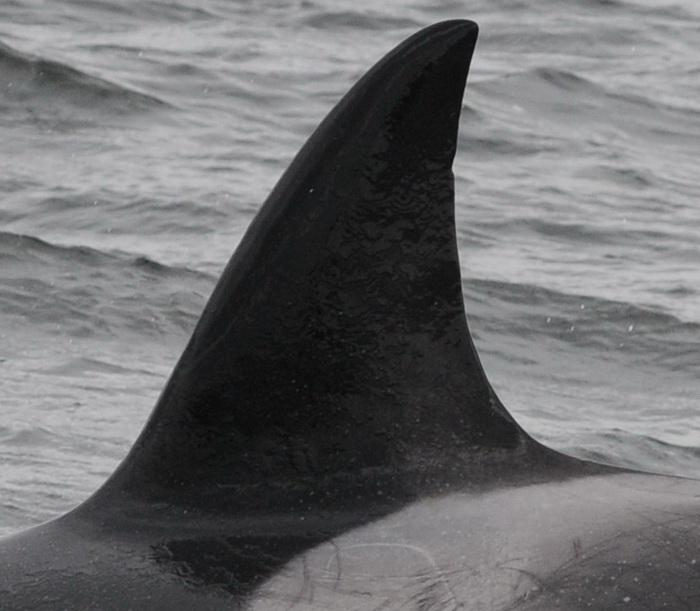
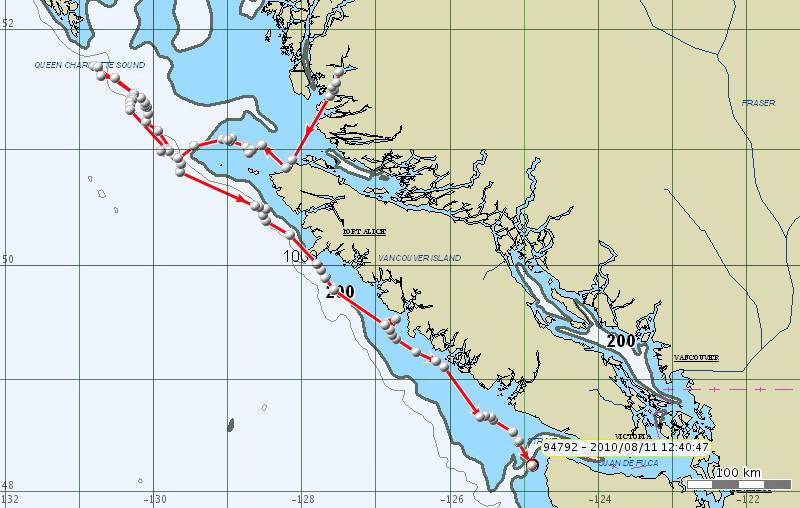
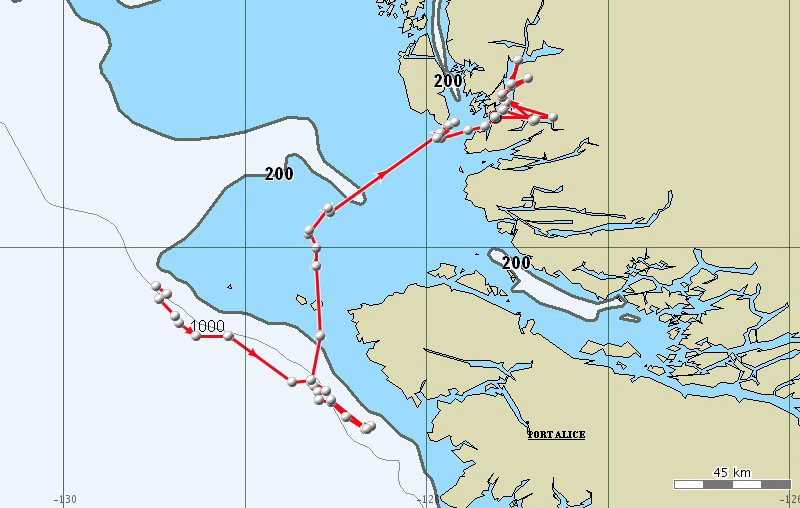
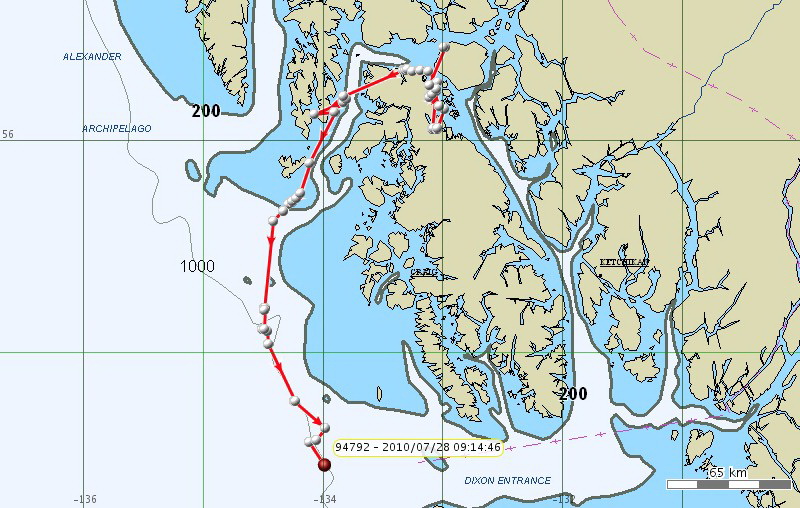
Below are a recent series of maps of the movements of T99A over a one-month period, with the most recent maps at the top. For more information on this work scroll down to below the maps.
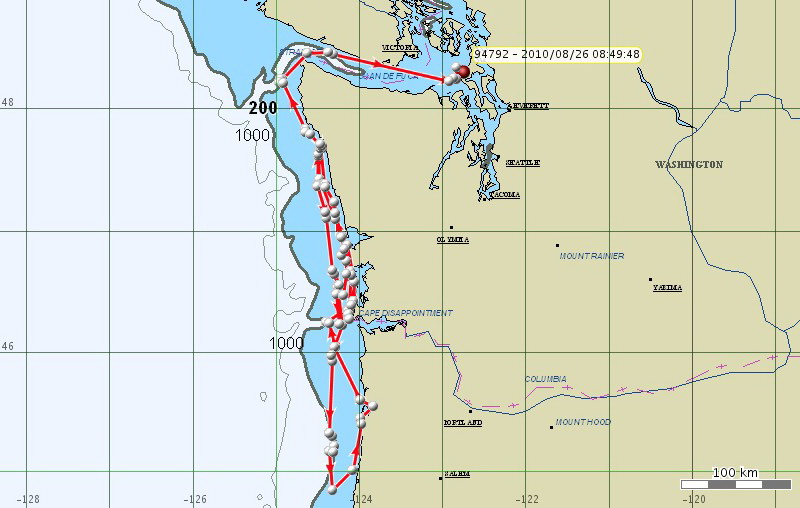
(#### image T99AMap-2010-08-16_5daysallLC.jpg missing from cascadia site)(caption “Map of movements of mammal-eating killer whale T99A, from August 11 to August 16, 2010.”)
These tags were originally developed by Russ Andrews (of the University of Alaska Fairbanks and the Alaska SeaLife Center) to examine movements of killer whales in Alaska and the Antarctic (download a pdf of their paper on Antarctic killer whales), and researchers in Alaska and California are also using them to study movements of both fish-eating and mammal-eating killer whales. We have been using these same tags to study movements of cetaceans in Hawaiian waters (see more information here) as well as off the coasts of California, Washington and Alaska.
Mammal-eating killer whales are important top predators in the North Pacific. In recent years there has been a great deal of debate on the role these whales play in influencing their prey populations. Understanding the movements of these animals is a critical component to assessing their influence on prey populations, as well as assessing their vulnerability to human impacts ranging from oil and gas development and transportation, exposure to high-intensity underwater sounds such as Naval sonar, and examining use of inshore areas with high levels of vessel traffic. Since 2008 we have deployed satellite tags on 15 killer whales in Washington state, with individuals tagged off the outer Washington coast (in April 2009 and April 2010), in Puget Sound (in September 2009 and February 2010), and in the San Juan Islands (in September 2008, September 2009 and May 2010). We have received location information from these tags for periods ranging from seven to 93 days.
Maps and animations of movements from some of the satellite-tagged killer whales are below, as well as photos of the tags on whales.
An animation showing movements of individual T30 tagged September 15, 2008 in Juan de Fuca Strait.(could be caption? Check size ####)
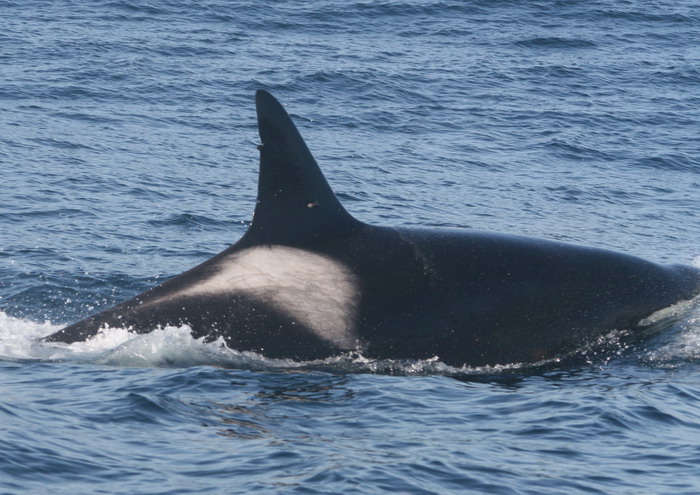
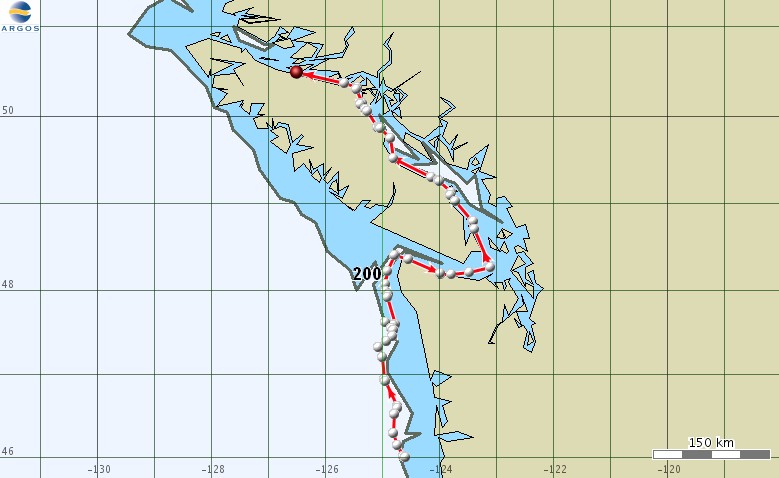
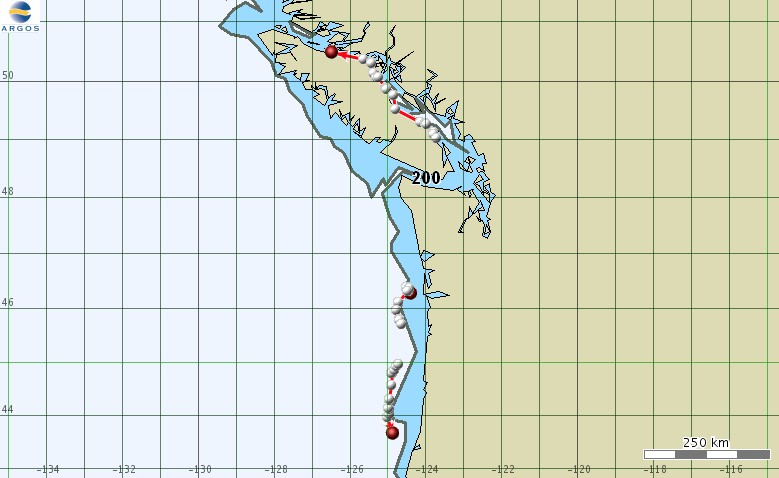
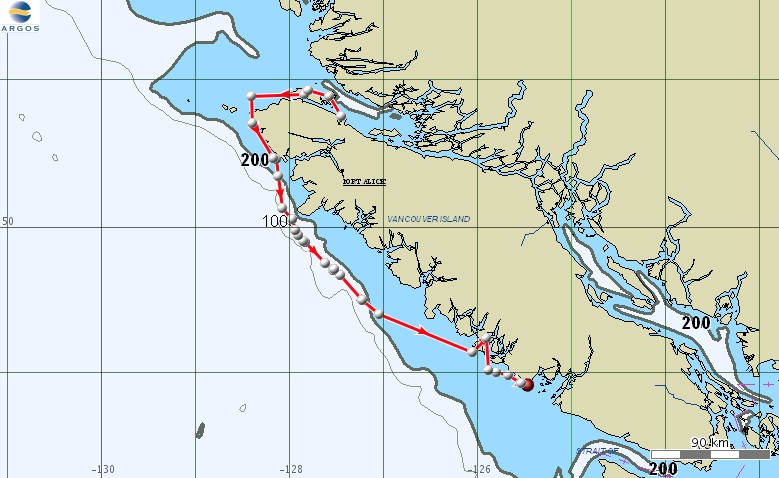
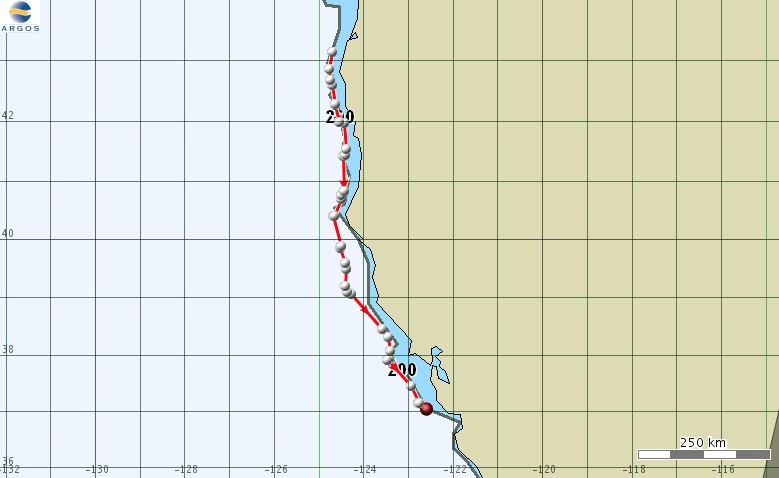
Three mammal-eating killer whales were satellite tagged during the NWFSC’s cruise on the outer coast of Washington and Oregon in late March and early April of 2009. Two whales were tagged off the coast of northern Oregon on April 6th out of a group of about 15 whales that included at least the T11s, T46Bs, and CA195, but also included several unIDable whales. One of the tagged whales was identified as T11.
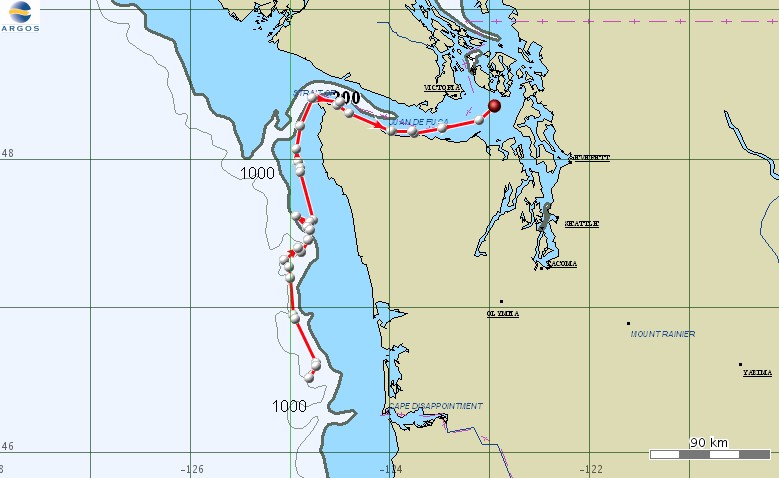
Example maps from the first 10 days of tracking are shown below.
Wondering why there are gaps in the tracks of our tagged whales?
In order to save on battery life, our satellite tags are programmed to transmit for 12 hours each day, during periods that correspond to the greatest number of ARGOS satellite overpasses. The tags have a salt-water switch, so only transmit when they are above the water’s surface, and have a minimum interval between transmissions of 30 seconds. The tags are set to transmit up to 500 times per day, but in order to obtain a location from the ARGOS system, the tag must transmit multiple times as the ARGOS satellite passes overhead, and the quality of the location (how accurate it is) largely depends on how many “hits” to the satellite the tag gets during a particular satellite pass (which only lasts 8-14 minutes). Some locations are very high quality (probably within a few hundred meters), whereas others may be accurate only +/- many kilometers, but still give a good idea of the general travel routes and habitat use.
We receive the location information once a day in the form of an e-mail from ARGOS, and can also access it on-line, although there is a delay (anywhere from 45 minutes to several hours) before the information is available on-line, so it is not particularly useful in locating the whales on a day-to-day basis.
Do we know exactly where the whales are all the time?
While the short answer is “no”, some background on how the Argos satellite system works is needed to explain this. Firstly, this system functions very differently than the Global Positioning System (GPS) most people are familiar with, and the Argos satellite system is not a simple or very accurate system. The transmitter on the whale emits a signal only when the whale is at the surface and only during a few specific hours a day when the transmitter is programmed to be on. In addition, the signal the transmitter emits can be received only by System Argos receivers which are only on NOAA’s polar orbiting weather satellites. Weather satellites orbit overhead about every 90 minutes, are overhead for only about 8-14 minutes and are generally most directly overhead during the morning hours to give weather forecasters a first look at cloud cover and/or environmental data the satellites collect. Assuming the satellite is overhead when the tag is turned on and the whale is at the surface, several signals are sent by the transmitter (each of which may be degraded by several factors, such as water on the antenna) to the satellite receiver. Assuming these transmissions are received (the transmitter produces a quarter watt signal that has to be detected by a satellite 800 miles above), these signals are then sent to a ground station which sends all the transmitter ID and frequency information to Argos headquarters in France for processing. Getting an estimated location requires the emission and receipt of a series of signals from a very stable frequency of the transmitter, and using a principle known as Doppler shift (this is what occurs when you hear a train horn sounding lower at the instant it passes by) a series of algorithms are applied to the signal data to estimate the transmitter signal’s location. Each location we receive has a location quality rating which estimates the amount of error associated with it. Argos has 7 location quality ratings, 4 of which have no error estimate associated with it – in other words the location may be correct or may be off by dozens of miles, usually the latter. Even for the 3 ratings that have error estimates assigned to them the actual locations can be off by up to a couple of miles. As might be expected we receive many more low quality locations than high quality locations. We typically only receive one or two high quality locations per day. In addition, the intial location that is received is preliminary such that additional post-processing that is conducted may significantly change the location. Unfortunately, this post processed information is not available from Argos for a month. Determination of the final set of locations requires the use of a filtering program to select those points that have the highest probably of being correct, based in part on the speed between consecutive locations. Consequently, of the numerous locations initially received each day only a couple might be considered reliable and even those are subject to having an associated error of several miles.
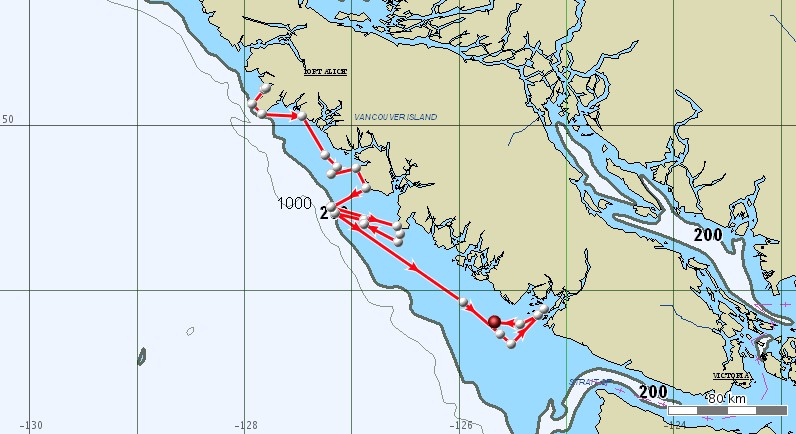
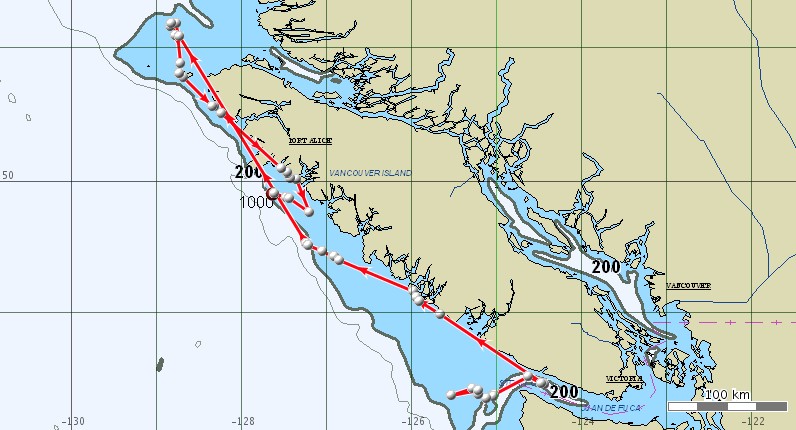
Ninety-four days of movements of T11, from April 6, 2009 through July 8, 2009. The tag transmitted daily for the first 50 days, then every second day for the next 16 days, then every third day for 21 days, and one final location on day 94.
Two other mammal-eating killer whales were satellite tagged in April 2009, both not distinctive female/sub-adult sized whales. One was tagged in the same group as T11 (designated #4 in this animation), and the other was tagged April 8, 2009. The tag deployed April 6 stopped on April 29, while the tag deployed April 8 stopped transmitting on April 30th. The complete tracks of both whales are shown in the animation above.
Photos on this page are copyrighted and are not to be used without permission. All tagging work was undertaken under the authority of National Marine Fisheries Service Scientific Research Permit No. 781-1824 issued to the Northwest Fisheries Science Center.